 Fast
Start to FTS Trader
Fast
Start to FTS Trader
Welcome to the online instructions for using the FTS trader. These instructions provide you with a quick summary of the basic operational details for using the FTS trader. The following topics are covered:
Login Screen for the FTS System
Launching the FTS Trader from the Virtual Classroom
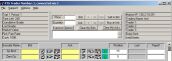
Login Screen for the FTS Trader
Screen Details (During the Login Period)
Screen Details (Immediately Prior to Market Opening)
Making Market (Limit Orders)
Taking Market (Market Orders)
Central Limit Order Book
Using Excel to Help Improve Your Trading Performance
Help for Assessing What a Good Price Is?
Login Screen for the FTS System
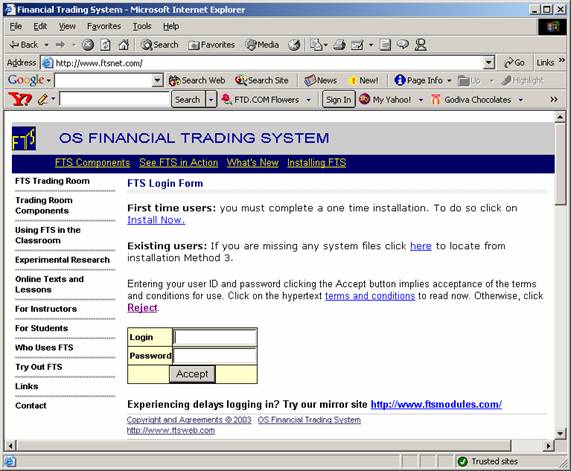
How Do I login for the First Time?